I run a podcast in my spare time for fun. Perhaps you already knew that. As one of the aspects of running a podcast is to make sure people can actually listen to it, choosing a place to host your audio is an important consideration. Since I’m the resident nerd on our podcasting team, I chose the service, and I chose AWS S3 (Amazon Web Services Simple Storage Service).
What’s the reasoning for choosing AWS? Well, it was free for 12 months, and when we had to start paying for it, the service was cheap and scaled well. The only downside is that there was no easy way to gauge how well we were doing in terms of subscribers/listeners or downloads. That is, until I decided to figure out how to do it myself.
The gist is this:
- copy down logs from s3
- parse them into a standard format
- feed it into Webalizer for statistics
- repeat daily
So how do you do it? Read on.
turn on logging for your S3 bucket

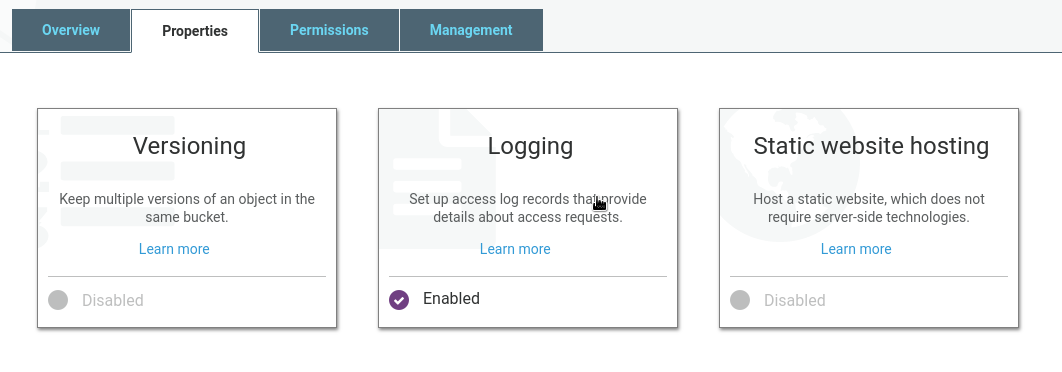
Click on the Properties tab in your bucket and select logging. Choose a folder in the bucket where the logs go and click Save. After a day or two, you should be able to start analyzing the log data (assuming people are downloading your stuff).
pull down the logs
aws s3 cp "s3://$BUCKETNAME/logs/" "$LOGDIR/" \
    --recursive --exclude "*" --include "$DATE*"
The easiest way to do this is to use the official aws-cli client. This is
where your terminal skills will come in handy. Make sure you set up your
credentials (~/.aws/credentials) so you can access your buckets.
The above code grabs all of the logs in the logs directory of the target
bucket and puts them in a pre-defined $LOGDIR. Notice the --recursive and
the include/exclude filters. These basically exclude everything (grab
nothing) except logs with filenames that start with a pre-defined $DATE. Since
AWS names logs beginning with the date, it’s easy to grab logs by the date you
want to analyze.
concatenate the logs
for i in "$LOGDIR/$DATE"*; do cat "$i" >> "$TMPLOG"; done
You have a few choices at this point; what you do largely depends on your own coding preferences. What I decided to do in my script was to take all the teeny log files AWS provides and combine them into one big temp log. I figured it made the most sense going into the next step.
filter out the garbage
cat "$TMPLOG" \
    | grep "REST.GET.OBJECT" \
    | grep -v "user/David" \
    | grep -v localhost \
    | grep -v "S3Console" \
    | grep -v "ld-cover.png" \
    | grep -v "$BUCKETNAME/logs" \
    | grep -v "$BUCKETNAME/blog" \
    | grep -v "$BUCKETNAME/social" \
    > "$PRSLOG"
My goal is to get the most accurate picture of my listeners, so I try to filter out any activity that is coming from me (i.e. testing new episodes before I publish) and any of the cruft that AWS adds to the log files. Depending on what you’re doing with your bucket, there may be other files you put in there that you don’t need to analyze, so you can filter them out.
In lovey-stats, I simply run the previously concatenated temporary log file
through a series of grep filters, piped one after the other. Perhaps there’s a
more elegant way to do it, but it seems to work well enough. You can see a
couple of the filters I created in the code above. The first one is to make sure
all I’m getting is HTTP GET requests. Anything not GET is irrelevant. After that
is a smattering of AWS junk (such as when you pull down log files…meta), a
localhost filter which prevents entries from development testing (you can block
this in a later step, too), and a few directories I don’t need to track.
convert the format to something readable
while IFS= read -r LINE; do
    remote_ip=$(echo "$LINE" | cut -d ' ' -f 5)
    dash="-"
    request_date=$(echo "$LINE" | cut -d ' ' -f 3-4)
    request_uri=$(echo "$LINE" | cut -d ' ' -f 10-12)
    http_status=$(echo "$LINE" | cut -d ' ' -f 13)
    bytes_sent=$(echo "$LINE" | cut -d ' ' -f 15)
    referrer=$(echo "$LINE" | cut -d ' ' -f 19)
    user_agent=$(echo "$LINE" | cut -d '"' -f 6)

    {
      printf "%s " "$remote_ip"
      printf "%s " "$dash"
      printf "%s " "$dash"
      printf "%s " "$request_date"
      printf "%s " "$request_uri"
      printf "%s " "$http_status"
      printf "%s " "$bytes_sent"
      printf "%s " "$referrer"
      printf "%s\n" "\"$user_agent\""
    } >> "$ACCLOG"
Unfortunately, the log entries themselves are not in any sort of standard format (unless you consider their log format a standard). So, the next step is to pull out the data points you want and rearrange them into something you can use. Given that the last step of this process is to run the log through Webalizer, we need a format that you would normally see from an Apache server. I chose the NCSA combined log format since AWS provides user agents (good for looking at how people are listening), so what we need is:
- connecting IP
- date/time
- requested URI
- HTTP status code
- bytes sent
- referrer
- user agent
As you can see above, lovey-stats uses the cut command a few times on each
line to grab the data we need, then prints them in the correct order into an
access log. Again, there may be a more elegant solution, but it works!
run it through webalizer

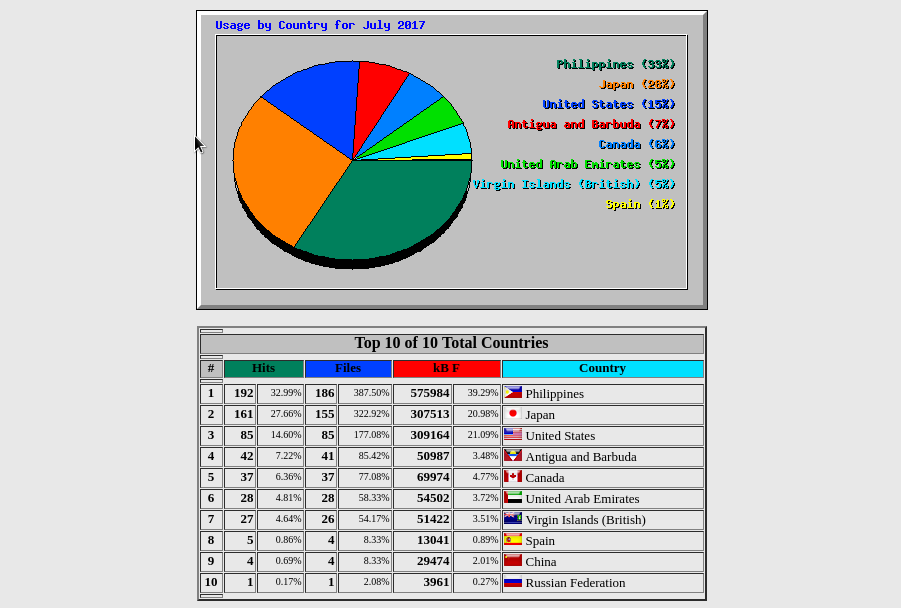
Finally, now that we have a concatenated, filtered, and reformatted log file, we have something ready to run through a web stats tool. All we need to do is run Webalizer on the log we generated and it will give us the stats we want! This, of course, assumes that you have Webalizer configured correctly, and you have a web server set up to serve the web pages that Webalizer generates for you. I will go into more detail about how to do those things in a future post.
can i automate it?
Of course you can. As is, lovey-stats will simply pull down yesterday’s
download statistics. This means you can set it to run automatically every day
and it will gradually build up stats day by day. That way, you’ll always have
the most up-to-date look at how your bucket is doing. Just use cron or write a
simple systemd unit file to run it daily and you’re off to the races!
In addition, you can also use it to look at a huge swath of data at once (up to 1 year, assuming you have the log data), if that’s what you want. Perhaps you have old logs sitting around doing nothing, and you want to see what was going on a while back. Just invoke the script and give it a date, a month, or a year, like so:
lovey-stats "2015"       # look at all of 2015
lovey-stats "2016-07"    # look at July 2016
lovey-stats "2017-07-31" # look at July 31st, 2017
Hope you find this useful!
Take a look at the full lovey-stats script on GitHub.
